Explains how Pandora’s Lunchbox decides what effects to apply and typical results from using it.
Simplified
- Clear All Existing Status Effects
All existing status effects (Cold, Hot, Poison, Drowsy, Injury, Hunger) are cleared to 0. - Rolls a value to set as the ‘effect budget’, like creating the size of a“status pie”
Chaos makes one roll to decide the total pool of status points it must hand out.
• Small pies and very large pies are possible, but most rolls land somewhere in the middle. - Possible effects
Cold or Hot, Poison, Drowsy, Injury, Hunger - Slice and assign the pie
- Chaos rolls a slice size.
• A big slice quickly eats the pie (fewer, stronger effects).
• Several small slices create more, lighter effects. - The slice is applied to a random effect still in the pool.
- That effect is removed from the pool. If Cold is chosen, Hot is also removed (and vice-versa), so you can never receive both.
- Repeat until the pie is gone or the leftovers drop below 0.05.
Result: a large pie can end up as a few heavy afflictions or many lighter ones—purely determined by those slice rolls.
- Chaos rolls a slice size.
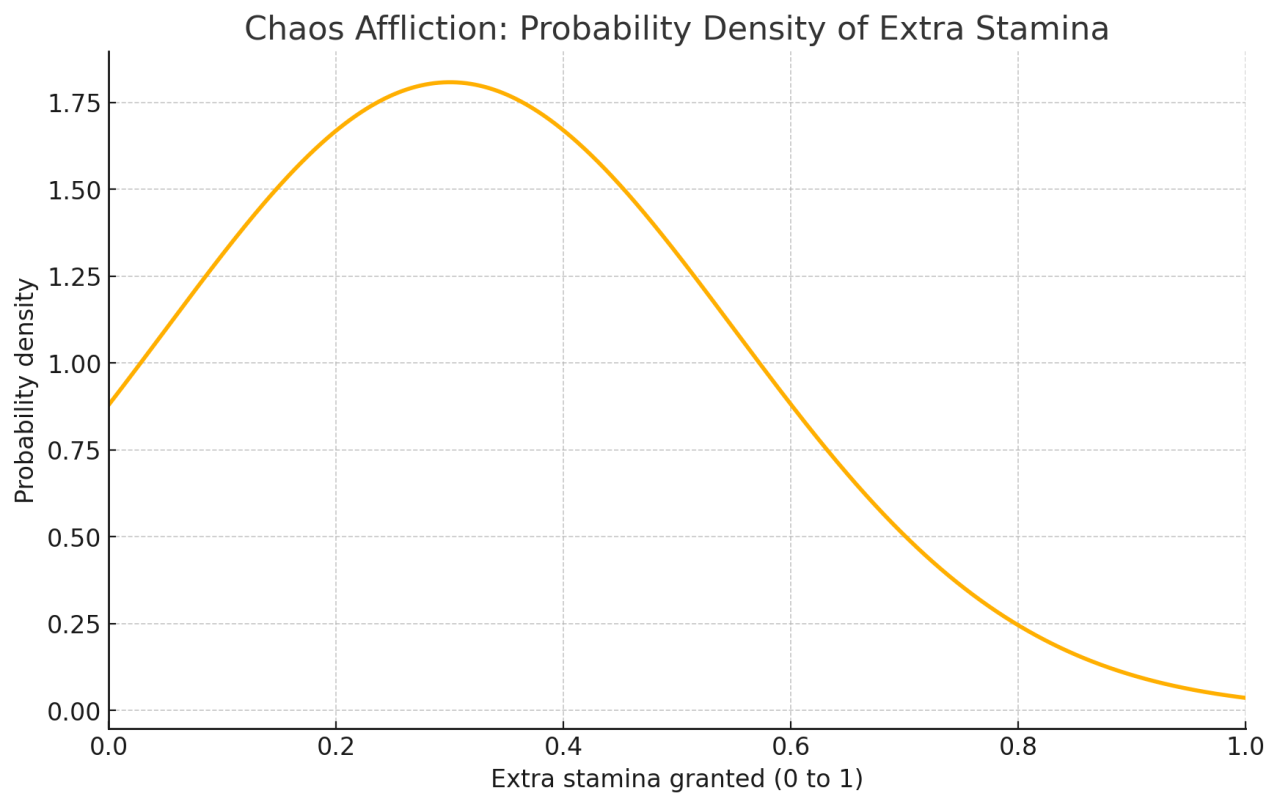
- Stamina bonus
Chaos makes a separate roll for extra stamina. On average you gain roughly a third of a bar, but zero or a full bar are both possible.
Typical Results
How much total affliction is applied?
- On average, you’ll get about 41% of your status bar filled with random status effects.
- Half the time, this value will be somewhere between 20% and 60%.
How many distinct effects are applied?
- You can expect about 2 effects on average, and usually between 1 to 3.
- Occasionally, it can be zero or up to the maximum of 5.
How much of each effect is applied on average/b]
- Each individual effect will take up about 21% of the status bar on average.
- Half the time, a single effect’s intensity will be between roughly 9% and 28%.
Monte-Carlo Sim, 100k activations
Metric
Mean
Middle 50 % (25-75 %)
Total affliction applied (% share of the bar)
0.410 ± 0.27
0.20 – 0.60
Slices / “chunks” added
1.91 ± 1.10
1 – 3
Distinct effects applied
1.91 ± 1.10
1 – 3
Per-effect intensity
0.209 ± 0.17
0.093 – 0.284
Stamina Bonus Calculation
Bonus Stamina Percent Added
Probability
0.00 – 0.10
11 %
0.10 – 0.20
15 %
0.20 – 0.30
18 %
0.30 – 0.40
18 %
0.40 – 0.50
15 %
0.50 – 0.60
11 %
0.60 – 0.70
7 %
0.70 – 0.80
4 %
0.80 – 0.90
1.6 %
0.90 – 1.00
0.6 %
Detailed Example
1. Roll a total “status budget”
Action
Result
Draw from N( 0.40, 0.30² )
0.3568
Clamp to [0 … 1]
0.3568
So you have 0.3568 status-points to hand out.
2. Set up the status pool
{ Cold, Hot, Poison, Drowsy, Injury, Hunger }
3. Chunking loop
Keep looping while budget ≥ 0.05 and the pool isn’t empty.
Loop
Draw multiplier (N 0.30, 0.50²)
Chunk size (total × multiplier)
Chosen effect
Pool after pick
Notes
1
0.2135
0.3568 × 0.2135 ≈ 0.0762
Poison (random index)
{ Cold, Hot, Drowsy, Injury, Hunger }
Budget left → 0.2806
2
0.3088
0.2806 × 0.3088 ≈ 0.1102
Cold
Cold is removed, and Hot is also removed (mutual exclusion) → { Drowsy, Injury, Hunger }
Budget left → 0.1704
3
0.5740
0.1704 × 0.5740 ≈ 0.0978, but only 0.1704 remains → 0.1704
Hunger
{ Drowsy, Injury }
Budget left → 0.0000 (loop stops)
Stop condition reached: remaining budget < 0.05.
Final debuff amounts applied
Effect
Amount
Poison
0.0762
Cold
0.1102
Hunger
0.1704
4. Roll the stamina bonus
Action
Result
Draw from N( 0.30, 0.25² )
0.2816
Clamp to [0 … 1]
0.2816 extra stamina